Saturday, March 26, 2011

Nifty Point & Figure (PnF) Analysis - Week 100328 - 0401

Weekly Analysis:


Daily Analysis:


Hourly Analysis:


Summary:

All in clear UP move. Target channel top near 5750. Support 5540 level.

The underlying bullishness was there in the weekly chart for long. Last week daily chart we read the support. Hourly is in mad UP move. Possible that the channel top is reached this series itself. I have seen this kind of "ascending triangles" often give false break-out. So got to be careful to take it as fresh bullishness. If this is a fresh bullishness there will be a new low in weekly chart. Only a fresh breakout of that new high will turn the market bullish.

Thursday, March 24, 2011

PnF Chart My 0.2 Cent Review - Part IV

In the last session we have seen the significance of box in P&F charting. In this write-up we try to see the effect of reversal points.

Reversal:

Reversal is the number of boxes (points) the price has to turn back to initiate a new column. As the name suggests "reversal" implies a change in the current trend. So a running column of "X" will shift to a new column of "O" if the reversal gets triggered. Like box-size the value of reversal is also something debatable and comes often with experience.

Reversal therefore can be 1-point, 2-point, 3-point as many as one wants to keep. A long-term player will always go for a higher value reversal compared to an aggressive trader. However, box in my opinion can be decided independently but reversal is quite dependent on box-size. It's important to have complete understanding of the box size before picking-up the reversal points. Therefore, the reversal point is very important to decide in any chart. Wyckoff used 1-point reversal for his charts. Whereas other great proponents of the art have suggested a standard 3-point reversal.


I personally feel 3-point reversal works well in Indian environment. Different phases of the life-cycle of the stock can have different reversal points. When a scrip is going through the phases of consolidation / correction a higher reversal will help avoid getting into the traps of whipsaws. Whereas when in momentum a lighter reversal point helps trail and lock the profit before it's too late.

In the next write-up we would see an interesting and perhaps the most stand-alone characteristics of the P&F chart - price objective.

I see many people visit the page. Would encourage more participation in terms of sharing knowledge

Friday, March 18, 2011

Nifty Point & Figure (PnF) Analysis - Week 100321 - 0325

Weekly Analysis:


Daily Analysis:


Hourly Analysis:


Summary:

Daily seems to have given a support. Weekly & Hourly in agreement with 5300 level as ultimate support. UP side momentum starts only above 5550 level.

Even after knowing supports & resistances, trading is nothing but a calculated betting game. Bulls & bears both come heavily at this point as the risk for both are very less.

Happy Holi.

Friday, March 11, 2011

Nifty Point & Figure (PnF) Analysis - Week 100314 - 0318

Weekly Chart:


Daily Chart:


Hourly Chart:


Summary:

Weekly soon to get a direction. Daily & Hourly to reach any of the channel ends. UP side resistance 5710 - 5740 level. DOWN side support 5270 - 5300 level. I don't expect UP side to break past 5710 level, but the probability of breaking past 5270 level is high.

Let's pray to GOD that he keeps his creation as beautiful as he has created.

Tuesday, March 8, 2011

PnF Chart My 0.2 Cent Review - Part III

After a long long gap, thought of continuing the series that I started long back. My apology for not being able to put up this in time. Of course lack of time has been a factor, but I learned a little more in this gap. Having learnt the basics in first two parts, we now slowly get into the details of the game.

Please note: As I don't have that much time to post all in one go. I decided to go in steps. Whenever I get time I shall try to continue the sequel.

Box Size

As I explained the chart has got only two variables Box size & reversal. How well one can construct the chart depends upon these two things. Many people often ask the question what's the best box size? Before answering this question, let's understand how it impacts the chart.

Box size is inversely proportional to the sensitivity of the chart. So larger or higher the box size lesser the sensitivity. Box size is the built in filter. Similar like an EMA or SMA in a bar or candlestick chart. As what's the right period of moving average can not be answered so simply this also can not be simply answered straightway. However, one can always use it to one's advantage in a definite way.

Let's take an example. Say we have three different time frames that we study - weekly, daily, hourly! Now putting the same box size in all three definitely does not help! Higher time frame should simply have a higher box size compared to the lower time frame. However, how high or how low is the question.

This can be answered partially if we take help of one technical indicator called ATR (Average True Range). This finds out the true range of any instrument for the following day. A 25% of the ATR in any time frame can be taken as a guiding box size for a three point reversal chart. Why 25%? In P&F we take generally three box reversal. So actually our range also alters in the strike of the fourth box. Therefore, a one-fourth assumption of the range works nice. However, there is nothing better than your visual comfort.

Having fixed the box size, one can do sort of backtesting to check a few things for compatibility. First, check at least one up move and one down move is fitting the 45degree channel line (i.e. touching two peaks or troughs). Second, the VPO or HPO (We will discuss about them in details in subsequent chapter) is working in atleast two or three major occasions. Third, the hard constraint: you must keep the box size to certain minimum level so that the whole of the price movement is contained in the plot area. Look at the following chart for yourself to see how the charts change with varying box sizes for Maruti daily prices. ATR for Maruti is near 50.

5-box chart
10-box chart
13.6-box chart
15-box chart


30-box chart


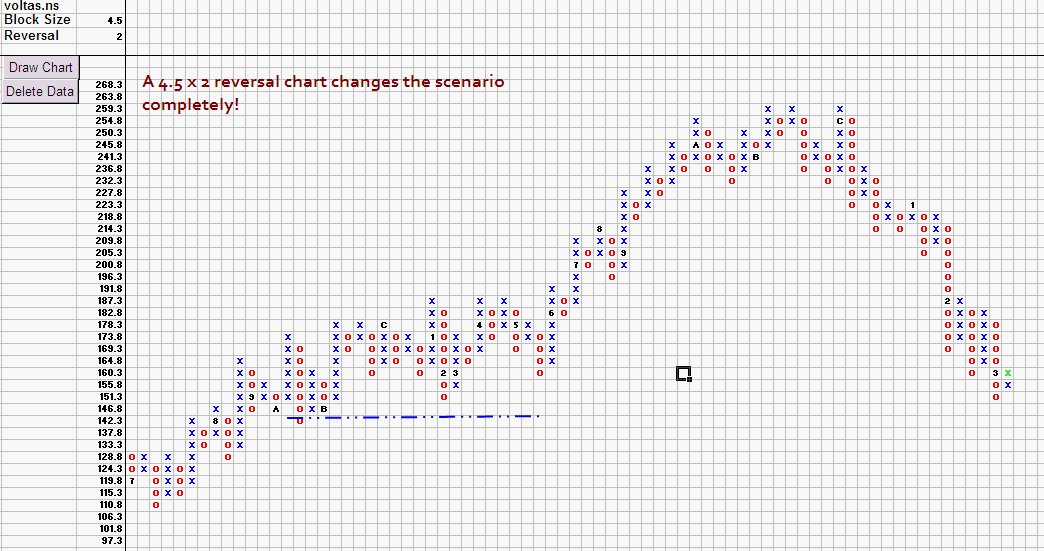
In the next sequence, we will evaluate the effect of the "Reversal".

People who follow P&F would request to participate in this discussion. This is just my 0.2 cent, 99.8 is there with you. Would be fortunate even to get 0.1 cent from that.

Friday, March 4, 2011

Nifty Point & Figure (PnF) Analysis - Week 100307 - 0311

Weekly Analysis:


Daily Analysis:


Hourly Analysis:


Summary:

Daily & Hourly suspicious premature reversal. Weekly yet to confirm. UP side resistance 5670. DOWN side supports 5345 - 5375.
Notice the long-term view in the weekly chart. If we do not get past 5700, the target price objective is 4500 level. Now don't expect a time line from P&F chartists. :)

Wednesday, March 2, 2011

Mid-week update ... Week 100228 - 0304

Refer last post for the weekly analysis.

Hourly Chart Update:


Got some time to update the chart. All other time-frame charts maintaining the status quo, just updating the hourly chart. It's moving as planned. Targetting 5660 - 5700 level. There is an HPO of 12*3*10 = 360 points from the base of 5314 level. So target is 5314 + 360 = 5674. Watch out 5400 level for negation.