
Friday, December 31, 2010
Some simple resolves for the year ... 2011
An opportunity to thank all of you whole-heartedly. I have learnt a lot on this way from many of you. There will be many to count. A special mention for my sir 'iLango'. Sir you taught me character. I think that's the most important thing a trader should have to succeed. I have often been able to read the charts quite successfully, it's only my character that let me down.

Friday, December 24, 2010
Nifty Point & Figure (PnF) Analysis - Week 201227 - 1231
Weekly Analysis:

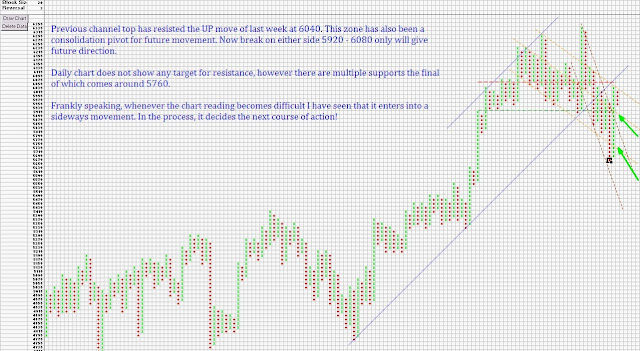
Daily Analysis:

Hourly Analysis:

Summary:
Weekly & Hourly in UP mode. Daily undecided in a range. Resistance 6130 - 6140 range. Support 5940 - 5700.

Daily Analysis:

Hourly Analysis:

Summary:
Weekly & Hourly in UP mode. Daily undecided in a range. Resistance 6130 - 6140 range. Support 5940 - 5700.
Saturday, December 18, 2010
Nifty Point & Figure (PnF) Analysis - Week 201220 - 1224
Weekly Analysis:

Daily Analysis:

Hourly Analysis:

Summary:
Week & Daily seeking direction. Hourly in UP move. Major resistance to monitor 6095 - 6105. Support minor 5750, major 5500. The three time frames have some confluence in terms of the resistance at 6100.

Daily Analysis:

Hourly Analysis:

Summary:
Week & Daily seeking direction. Hourly in UP move. Major resistance to monitor 6095 - 6105. Support minor 5750, major 5500. The three time frames have some confluence in terms of the resistance at 6100.
Tuesday, December 14, 2010
Nifty Point & Figure (PnF) Analysis - Week 201213 - 1217 - Update on 1412
This is a mid-week update. Joda, I think we still need some confirmation.
Hourly Chart:

Daily Chart:

Summary:
A decisive move above 6135 only confirms a new high. Until then all DOWN side possibilities exist. Movements might be in sideways till the week comes to end.
Hourly Chart:

Daily Chart:

Summary:
A decisive move above 6135 only confirms a new high. Until then all DOWN side possibilities exist. Movements might be in sideways till the week comes to end.
Sunday, December 12, 2010
Nifty Point & Figure (PnF) Analysis - Week 201213 - 1217
Weekly Analysis:

Daily Analysis:

Hourly Analysis:

Summary:
Weekly still DOWN. Daily found support. Hour UP trending.
Immediate resistance: 5560 >> (6080-6100), Support: 5790 >> 5540.
Special Note: TPO for DOWN side calculation: 6007 - 16*10*3 = 6007 - 480 = 5527

Daily Analysis:

Hourly Analysis:

Summary:
Weekly still DOWN. Daily found support. Hour UP trending.
Immediate resistance: 5560 >> (6080-6100), Support: 5790 >> 5540.
Special Note: TPO for DOWN side calculation: 6007 - 16*10*3 = 6007 - 480 = 5527
Saturday, December 4, 2010
Nifty Point & Figure (PnF) Analysis - Week 201206 - 1210
Weekly Analysis:

Daily Analysis:
Hourly Analysis:

Summary:
Weekly & Hourly show resistance at present price level or around 6180 level. Supports in different time frames come at 5890 >> 5740 >> 5620 level.

Daily Analysis:

Hourly Analysis:

Summary:
Weekly & Hourly show resistance at present price level or around 6180 level. Supports in different time frames come at 5890 >> 5740 >> 5620 level.
Saturday, November 27, 2010
Nifty Point & Figure (PnF) Analysis - Week 201129 - 1203
Weekly Chart:

Daily Chart:

Hourly Chart:

Summary:
All three DOWN. Weekly target intact 5500. Daily & Hourly strong resistance 5940.

Daily Chart:

Hourly Chart:

Summary:
All three DOWN. Weekly target intact 5500. Daily & Hourly strong resistance 5940.
Saturday, November 20, 2010
Nifty Point & Figure (PnF) Analysis - Week 201122 - 1126
Weekly Chart

Daily Chart

Hourly Chart

Summary
All three DOWN. Weekly support deep at 5500! Daily & Hourly immediate support 5810 - 5820. Resistance to bounce back 5960 - 5980.

Daily Chart

Hourly Chart

Summary
All three DOWN. Weekly support deep at 5500! Daily & Hourly immediate support 5810 - 5820. Resistance to bounce back 5960 - 5980.
Wednesday, November 17, 2010
PnF Chart My 0.2 Cent Review - Part II (A)
In the introductory part, so far we have seen why and why not PnF. Let me recapitulate the same again.
Why -
Understand
In this section we will understand the philosophy under which it came into picture. But before this it's worth to thank those great people who gave birth to and nurtured such a wonderful system. A little about them.
The way I see it is a bit different than what most of the vanilla literature talk about it. It's a chart of pure price movement in two directions - either UP or DOWN. There is nothing else in it. Unlike other charts - line, bar, candle it does not change the directions immediately. Market to me is just like a School class room without a teacher. It's in utter chaos, you can't hear anybody nobody can hear you and it goes on but there is so much noise. The noise often comes out of class room walls but students almost never. But when the teacher comes in, almost everything is in order! The teacher is the fundamental and the class are us the market players.
This PnF method, therefore, tries to elevate the market from a School class room to a College class room. Where it incorporates a discipline and puts a tolerance limit beyond which only the participants will react. It forces us to be disciplined and not get swayed in absence of fundamental clarity. So how does it do all these philosophical talk?
Chart Construct
The chart is constructed with four components:
So, we see Open and Close prices are of no use except for some overlay on the chart itself.
Concept
Buffer figure: Block size * Reversal
Let's take an example here.

Quick Tips:
The moment a PnF chart is flashed, we need to see one thing first - Construct, i.e. Block Size = 1, Reversal = Can not be ascertained from this chart (assume 3)
Now coming back to the example. This chart shows that the down trend is on. Current price is within 11 to 13 (assuming 3 point reversal).
Say, next day the H-L is 14 - 10. So what do we do next? Though there was test of high but the rule of the chart will ignore this as a noise and go ahead and put one "O" at 10! Now practically, if somebody observes the day movement and if the movement has been from 'High to Low', the chart's point of view is valid as the upside movement can be considered as 'noise'. However if it happened from 'Low to High', then this is not valid. But if up trend continues, next day the chart will anyway change column from "O" to "X".
So block size and reversal are two very important concept in this. Trend increases the price by incremental block and reversal happens beyond certain level of price point and not at every fluctuation.
In the next part of the we will straightway enter the analysis part and shall try to spend maximum time in analyzing several real-life charts.
Why -
- Simple
- Less technology and technical involved
- Less whipsaws as in-built filter exists
- Recommended for medium to long-term investment analysis
- Short-term analysis difficult
- No time-frame can be theoretically associated with this method
- Leverage positions are difficult to manage without deep pocket
Understand
In this section we will understand the philosophy under which it came into picture. But before this it's worth to thank those great people who gave birth to and nurtured such a wonderful system. A little about them.
Read History section in this link: http://en.wikipedia.org/wiki/Point_and_figure_chart
The way I see it is a bit different than what most of the vanilla literature talk about it. It's a chart of pure price movement in two directions - either UP or DOWN. There is nothing else in it. Unlike other charts - line, bar, candle it does not change the directions immediately. Market to me is just like a School class room without a teacher. It's in utter chaos, you can't hear anybody nobody can hear you and it goes on but there is so much noise. The noise often comes out of class room walls but students almost never. But when the teacher comes in, almost everything is in order! The teacher is the fundamental and the class are us the market players.
This PnF method, therefore, tries to elevate the market from a School class room to a College class room. Where it incorporates a discipline and puts a tolerance limit beyond which only the participants will react. It forces us to be disciplined and not get swayed in absence of fundamental clarity. So how does it do all these philosophical talk?
Chart Construct
The chart is constructed with four components:
- Graph sheet
- Two symbols - X (for UP) & O (for DOWN)
- Daily data with Open, High, Low & Close (High & Low are must)
- A buffer figure - Block size (Chart Sensitivity) * Reversal (Noise Filter)
- If current symbol is X -->
- Check New High > Last High + Block Size --> Plot one more X on top of last X else
- Check New Low < Last High - Buffer --> Plot one O at new block position
So, we see Open and Close prices are of no use except for some overlay on the chart itself.
Concept
Buffer figure: Block size * Reversal
Let's take an example here.
Quick Tips:
The moment a PnF chart is flashed, we need to see one thing first - Construct, i.e. Block Size = 1, Reversal = Can not be ascertained from this chart (assume 3)
Now coming back to the example. This chart shows that the down trend is on. Current price is within 11 to 13 (assuming 3 point reversal).
Say, next day the H-L is 14 - 10. So what do we do next? Though there was test of high but the rule of the chart will ignore this as a noise and go ahead and put one "O" at 10! Now practically, if somebody observes the day movement and if the movement has been from 'High to Low', the chart's point of view is valid as the upside movement can be considered as 'noise'. However if it happened from 'Low to High', then this is not valid. But if up trend continues, next day the chart will anyway change column from "O" to "X".
So block size and reversal are two very important concept in this. Trend increases the price by incremental block and reversal happens beyond certain level of price point and not at every fluctuation.
In the next part of the we will straightway enter the analysis part and shall try to spend maximum time in analyzing several real-life charts.
Saturday, November 13, 2010
Nifty Point & Figure (PnF) Analysis - Week 201114 - 1118
Weekly Analysis:

Daily Analysis:

Hourly Analysis:

Summary:
Weekly still limited to Correction. 5900 break will target 5500.
Daily Chart is in DOWN mode, 5900 - 5940 support.
Hourly chart nearing (6013) a bounce zone, 6150 - 6170 should be the resistance zone for the bounce back.

Daily Analysis:

Hourly Analysis:

Summary:
Weekly still limited to Correction. 5900 break will target 5500.
Daily Chart is in DOWN mode, 5900 - 5940 support.
Hourly chart nearing (6013) a bounce zone, 6150 - 6170 should be the resistance zone for the bounce back.
Monday, November 8, 2010
Nifty Point & Figure (PnF) Analysis - Week 201107 - 1111
Some Recaps:
I fear whether this sounds retro and boastful. However, the intention is to show that almost all the methods that the great chartists and technicians have put to use over time, hold some value even today; it's upto us to salvage them. Not following any other technical indicator and only PnF chart, I was able to read that 5940 will be the final support even two weeks before and recommended buying equities. Last week also the chart read that if 6180 taken, 6220 will also be taken.
The only problem I find in my reading that when I try to do too many things, it gets biased! I hope I get rid of the problem soon.
I have started scribing the details in the chart itself. Hope, this will be more meaningful as at the same time the chart and the write-up can be referred.
Weekly Chart:

Daily Chart:

Hourly Chart:

Summary:
Hourly & Daily chart have broken the down channel and is in expansion mode. Resistance is not established as of now. Support lying in the zone 6220 - 6240.
Weekly chart wants to set in new territory!
Friday, November 5, 2010
Some Diwali Wishes
Wish all a very happy, peaceful and prosperous Diwali.
Thought of mining some charts and of-course the special treasure-hunt "Reliance"! Charts are self-explanatory. Unfortunately or fortunately, PnF knows only one thing - price! No indicator, no time. Act as per price. Simple ... :)
INDIAINFO

KOTAKBANK

ABIRLANUVO

RELIANCE

Thought of mining some charts and of-course the special treasure-hunt "Reliance"! Charts are self-explanatory. Unfortunately or fortunately, PnF knows only one thing - price! No indicator, no time. Act as per price. Simple ... :)
INDIAINFO

KOTAKBANK

ABIRLANUVO

RELIANCE

Thursday, November 4, 2010
Unitech Analysis
Daily Chart of Unitech:
Considering lots interest floating around the Unitech, thought of putting up PnF view point of the daily chart. The details are explained in the Chart itself.

Considering lots interest floating around the Unitech, thought of putting up PnF view point of the daily chart. The details are explained in the Chart itself.

Saturday, October 30, 2010
Nifty Point & Figure (PnF) Analysis - Week 201101 - 1104
Weekly Analysis:

Weekly chart has bounced back two points (80) before the support level. The recoiling effect is on. Hopefully the high of the recoil is made. Don't see it break the high of 6180. If it breaks past this, the momentum will take it past 6220.
Daily Analysis:

Interesting thing is the DOWN channel is shifting to a lesser momentum channel (Pink one). However, multiple resistance lines are lying at different points. Not all of them might act, but one needs to be careful. In order of their sequence: 6060 >> 6120 >> 6165. Support lines are lying at 5960 >> 5920 >> 5860.
Hourly Analysis:

Hourly chart is going through a transition from one slope to another one. Support lines are lying 5950 >> 5930. Breaking them goes through 5870. Resistance lines are 5060 >> 6120. Important thing is that there is a confluence coming around 5860 - 5870. If the correction is on, I expect some 20 columns to be spent before the next impulse comes.
Summary:
Daily & Hourly are in perfect sync. Resistance: 6060 >> 6120 >> 6165; Support: 5960 >> 5920 >> 5860.
Momentum of fall should be controlled now.
Wednesday, October 27, 2010
PnF Chart My 0.2 Cent Review - Part I
Introduction:

PnF Chart, also known as Point and Figure Chart. The theories and literature etc. can be found out through several sources - Google, Right hand side section on
"Point and Figure Study Material". I would request readers to go through the basic stuffs of this method before starting on this journey. I shall talk here only about the subsequent stuffs I managed to learn post those basic stuffs.
"Point and Figure Study Material". I would request readers to go through the basic stuffs of this method before starting on this journey. I shall talk here only about the subsequent stuffs I managed to learn post those basic stuffs.

Important thing to mention here is - it's a chart purely based on Demand & Supply equation. If there is demand and increasing demand, we keep on adding a cross- say Figure and if there is supply and increasing supply we keep on adding a dot(say Point) - called Figure.
Unlike other methods of charting this does not have any other indicator except price. But the depth of this technique is that a built-in support and resistance are there in the construct of the chart. A reversal in direction of the movement does not happen until certain level of resistance or support is broken. We will talk in details about this concept when we get into the technical details of the charting method.
The popularity of this method is in its simplicity. It can help one in following the trend, identify the reflection points, channel support / resistance. However, where it scores much higher than other methods in its ability to predict the Target Price Objective (TPO or PO). A "head & shoulder" method or a "contracting triangle" or many such technical patterns also give the probable target. But the difficulty is if those patterns are not formed we are really not sure of the target. In case of PnF method this problem does not happen. Because, it predicts the TPO based on accumulation in the support line or distribution in the resistance line.
This method existed for a longer period of time in vogue, because one could construct this chart without the help of even a computer. All one needs is a graph paper and keep plotting. Even today many people use it with great success.
As today's market is very complex and getting more complex day by day with participation from all section of people. Almost all the business houses come to market for "risk-free-return"! Of-course we have those big investment bankers, mutual funds, the big-bulls & bears (and they include the media buffs also). On top of count those computer whiz who are great in manipulating the price points and create "spike-heel tension"! So, some play with money power, some with
However, all of them have one motive in common - to make money. And that's put the balance back into the game. We find "pattern in randomness". All we poor souls of the game got to do is to understand the fundamental of the game and stick to the basics. Simultaneously, as the rules of the game change, we need to adapt to it quickly. But remember the basics of the game remain the same.
The above paragraph might sound like a bit of Knowledge session. But that was a prologue to subsequent two paragraphs where I talk about why we find PnF method often failing to live up to the promise.
There is nothing in the method that will fail. It's actually our understanding and interpretation using this method that fails! What I mean here is that may be a particular pattern has been working fine for so long but a few instances we notice that suddenly it's not working the way it did last time. Like any other TA (Technical Analysis) method, it always comes with two options - UP side and DOWN side. The probability of the same could vary depending upon the cart type, but it will always exist! That's where it starts failing. Because, often we fail to accept that the other side always existed.
Though a built-in buffer exists, it often can give whipsaws like other TA methods. But, one thing can be definitely vouched for that the number of whipsaws are much less compared to other methods. As the depth of reversal is quite large in this method, a highly-leveraged position is not that suitable under this method. What it means is that holding pure cash (equities) is much more comfortable compared to a derivative (F&O) position.
Another big problem with this method that there is no time dimension to it. Though one can mark the same with a change in color or some other notation but that's only for identification purpose. The basics of the chart really don't talk about time. So taken a position we really don't know when we reach there.
In the next section, we will talk about the technical aspect of this method. Next to that we shall discuss about the application and nuances of the same. Your inputs or comments will be highly appreciated. With my limited knowledge on the subject, I shall invite comments / write-ups from the pros who can share more on these topics.
Saturday, October 23, 2010
Nifty Point & Figure (PnF) Analysis - Week 201025 - 1029
Weekly Analysis:

As we can see nothing much has changed in this chart even after 2 weeks. Except for the fact that it has almost reached near the support point of the ongoing correction!
So, for equities the buying time has arrived. Need to be cautious only when it goes down 5840 decisively.
Daily Analysis:

Daily chart is moving in a perfect DOWN channel of 160 points. Immediate channel resistance at 6120. Breaking up will test next channel resistance at 6220. In the DOWN side, there are important observations. DOWN channel and previous base support are crossing each other. I shall go with the base support 5960 to be the final support.
Hourly Analysis:

Hourly chart is going through volatile corrections in multiple intermediary resistance & supports. However, the critical juncture of reversal is very near as the previous consolidation zone (red-blue band) is interacting the DOWN channel.
UP side immediate resistance 6120 > 6180. DOWN side support 6020 > 5960.
Summary:
A reversal in Hourly & Daily chart is very near. Either it goes DOWN to 5960 and then moves up breaking all resistances. OR way UP will face resistance at 6120 then 6180 and retest 6020 and / or 5960 for the last time before the reversal.
Weekly chart still gives a possibility of 5860! But, I'm giving less weightage to them as per the Daily / Hourly charts.
Monday, October 18, 2010
Update on Last weeks Analysis
Sorry for not being able to post this week's charts. A bit engaged in DP (Durga Puja) ... Wish you all a Happy Dussera!
Happy to see that our chart reading is falling in place as per plan ... summary said "expect 6160 to push it back to 5960 - 5980. Buy at this zone (5960 - 5980)"
So far that's what has happened! It has hit 5985. This could have been taken as a buying point. As long as 5940 is not broken decisively, we keep buying.
Shall try to post the chart later in the week.
Deemis:
Shall try to put a write-up for the questions you asked in some leisure time.
Sunday, October 10, 2010
Nifty Point & Figure (PnF) Analysis - Week 201011 - 1015
Weekly Analysis:

Weekly chart breaking above the channel perhaps in the making of a new channel and thereby a new territory ... if that's what happens, we are definitely breaking the all time high!
The minor hiccups and perhaps second zone of consolidation before it takes off the all time high might happen at 6300 - 6380 zone! Weekly correction shall restrict itself to a maximum of 5860. A good buying point for industry specific equities.
Daily Analysis:

Daily chart shows that after hitting almost the bottom of the intermediate UP channel has started moving up. Might get resisted half-way at 5160 and then starts moving DOWN again for 5980 zone! This shall be a low-risk buying zone.
Hourly Analysis:

Hourly chart has established an intermediate DOWN channel. Now moving up, should meet minor resistance at 5160 and start moving downwards to break this channel and meet the previously built heavy support zone at 5950 - 5970 zone.
Summary:
In short-term, expect 5160 to push it back to 5960 - 5980. Buy at this zone (5960 - 5980). However, weekly chart is still not giving a clear picture (remember a correction upto 5860!). But for that one thing is sure daily & hourly chart has to break 5940!
ISPATIND (Daily Chart):

ISPATIND is forming a huge consolidation / distribution zone! If it's consolidating, it has to break 24.15 and PO is 30+. If it's distributing, it has to break 21.9. We hold our position till it is resolved!
Saturday, October 2, 2010
Nifty Point & Figure (PnF) Analysis - Week 201004 - 1008
Weekly Analysis:

Last week though I depicted in chart the correct band of movement. I went conservative and quoted figures less by 2 points (2*40 = 180). I quoted 6100, whereas actual is 6153 (in the Figure, it's at 6180 Point).
This is the effect of the huge break-out started from the level of 4940! We don't realize but it has moved 1200 points! Almost in one direction after long-periods of consolidation. Even then I could catch only a few of those points (and not to forget lost a few also!).
This week as I see, it has broken above the extreme UP channel. Hardly any room to move up. A DOWN side support half-way at 5820 - 5860. This is a very good entry point for testing the all time-high!
Daily Analysis:

Daily chart reading was quite effective. Expected the triangular force to give a high-target in the range of 6100+.
Now that it has broken. As per P&F calculation, it should now target 9*20*3 = 540 points from the bottom of the consolidation zone (5940), i.e. 5940 + 540 = 6480! Well, I know that's a new HIGH! But, this is under the condition that the support 5940 does not get broken ever before the target is achieved!
We see the existing UP channel is offering some resistance. Support should be very near-by 6060, break of which should 5960. But in all possibility a new UP channel is in formation, and perhaps we need to shift to that momentum (which in Elliott Wave is known as V-th wave!)
Hourly Analysis:

A staggered break-out (second attempt) has happened in Hourly chart. But, it has happened quite clearly. Near-term support as of date seen half-way 6050 - 6060!
Summary:
UP side momentum can get a temporary halt. 6060 should be seen as an entry point. However, convincing break of it (6060), 5960 should be next target for entry. Even if that (5960) breaks, 5860 should be a must entry point for a long target!
Sunday, September 26, 2010
Nifty Point & Figure (PnF) Analysis - Week 20100927 - 1001
Weekly Analysis:

Weekly chart last week suggested 6020 as the target and it reached 6030. The current chart shows in high resistance zone. Even if the UP side continues, it should be limited to 6060 - 6100. DOWN side should first break 5980 and subsequently can face the support at 5820 - 5860.
Daily Analysis:
 However, we read Daily chart with a little bias and predicted minor pullback at 5760 level before it could take-off up side, but it did so without testing the down side. This tells that till intermediate profit-booking has not happened.
Now the chart has entered an Accumulation-Distribution zone. The horizontal triangle in formation, with two bases. Break of DOWN side 5940 shall target 5820 - 5840. Or else UP side starts on break of the slant side of the triangle. If it spends more time, the force of the thrust will be quite high on UP side with targets of 6100+.
Hourly Analysis:

Hourly chart reading was comparatively satisfactory. New UP side found on break of the erstwhile intermediate UP channel (maroon). It has entered now a trading zone 5950 - 6040. Break on DOWN side shall either oscillate in the intermediate DOWN channel (maroon) or shall approach towards the previous UP channel (Blue) 5840 - 5860.
Summary:
Weekly in resistance zone, maximum upside 6060. Daily in congestion zone with DOWN side 5840 - 5860. Hourly in trading zone 5950 - 6040.
ISPATIND Update:
Buy price triggered. SL to be maintained as in the last post. Target remains same.

Weekly chart last week suggested 6020 as the target and it reached 6030. The current chart shows in high resistance zone. Even if the UP side continues, it should be limited to 6060 - 6100. DOWN side should first break 5980 and subsequently can face the support at 5820 - 5860.
Daily Analysis:

Now the chart has entered an Accumulation-Distribution zone. The horizontal triangle in formation, with two bases. Break of DOWN side 5940 shall target 5820 - 5840. Or else UP side starts on break of the slant side of the triangle. If it spends more time, the force of the thrust will be quite high on UP side with targets of 6100+.
Hourly Analysis:

Hourly chart reading was comparatively satisfactory. New UP side found on break of the erstwhile intermediate UP channel (maroon). It has entered now a trading zone 5950 - 6040. Break on DOWN side shall either oscillate in the intermediate DOWN channel (maroon) or shall approach towards the previous UP channel (Blue) 5840 - 5860.
Summary:
Weekly in resistance zone, maximum upside 6060. Daily in congestion zone with DOWN side 5840 - 5860. Hourly in trading zone 5950 - 6040.
ISPATIND Update:
Buy price triggered. SL to be maintained as in the last post. Target remains same.
Subscribe to:
Posts (Atom)