Sunday, December 25, 2011

Nifty P&F (Wk 2612-30122011) - Bears had a year, Now one for Bulls?

Merry x-mas to all of you and P&F enthusiasts!

Recap:

Today I want you all to refer this Post on 1st week of March-2011 this talked about 4300 - 4500 as target! Now that was 9 months old reading, even last week's chart read 5800 >> 5000; it did. My belief on P&F has grown stronger day by day.

Weekly Analysis:


Daily Analysis:


Summary:

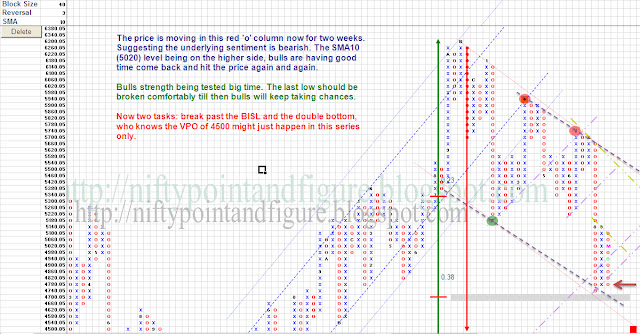
Weekly halted, daily UP. If 4660-4680 is held, possibly heading for 4840-4860.

Market is making possibly a bottom. The worst bottom, if not already made at 4540, should be 4300-4340. I am expecting a consolidation, if not a complete reversal from this point. Couple of points that I am considering:
  1. the channel bottom is being bought by the Bulls again and again.
  2. many of the nifty 50 stocks have given away a year's complete gain
  3. (though I don't understand much) Elliott wave suggesting a double zig-zag
  4. gold and rupees have done enough

Tuesday, December 20, 2011

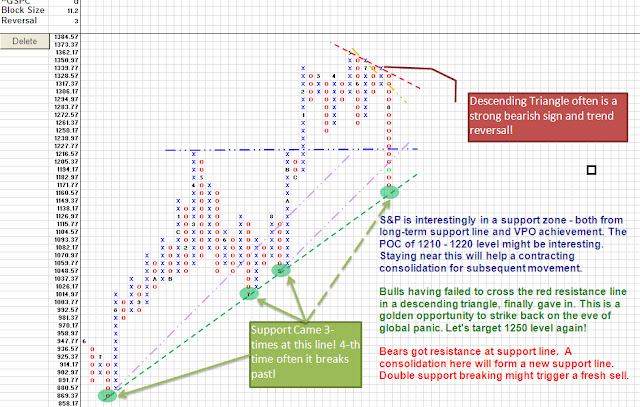
Critical update: S&P500 crossing 1262 might turn markets bullish

S&P 500 is showing an interesting chart! It has pulled-up from 62% fib and retraced to a channel top resistance. As I write this post, it's showing a reversal again and comfortably above SMA 50 (1227)! If it breaks past the channel top and closes above 1262, and subsequently a double top at 1295, we might see a Bull run upto 1395!This will definitely put Indian market also to a Bull phase.


Nifty might give one more opportunity to short at a higher level. A channel resistance near 4650-4660 might be a level. This could be the last short of this swing before Bulls come back at least for sometime.


It's always difficult to get the right level to enter. However, one should decide which side to play big, then it's possible to 'sell on rise' / 'buy on dip'. One can not have same R-multiples for each trade. While it's possible to have higher R-multiples at the begining of the swing, but as it comes nearer to end it's likely to result in trades of 1:1 R-multiples. But this being the trend side, often we might be surprised with higher expectancy ratio than we calculated.

To my fellow friends and traders, I would request to provide me with a good trader log or refer to something available online.

Indian equity market is really looking very dim. Most of the nifty 50 large caps are going to give away 100% of its gains since begining of 2009. I still maintain that the bear market that started from the top of 6345, should not breach 4460 (as it's the VPO). If that's the case, most of these stocks will bounce back from 62% or 78%, and the cash market should become active.

Saturday, December 17, 2011

Nifty P&F (Wk 1911 - 2312) - Bears target channel bottom 4580!

Recap:

Once again was wrong in expecting market to move another 100 points 4900. But having an alternate view helped exiting longs on break of BlSL.

Weekly Analysis:


Daily Analysis:


Summary:

Weekly & Daily both down. A weak chance of double bottom. Most probablistic target for bears 4580 >> 4500.

Tuesday, December 13, 2011

Nifty P&F (Wk 1211 - 1612) - Bears rest for higher levels

Appology for not being able to update the blog for last one month. It's just lack of time (management) in the weekend. However, did not miss a single move of the market.

Recap:

Well, price went below 4700 by 2 boxes and came back for a pause.

Weekly Analysis:


Daily Analysis:


Summary:

Weekly DOWN. Daily UPped today. A rangebound market till we resolve the triangle formed by the BlSL and the BrRL. Bias is on down side. Level to short 4910-4960. Breaking of the BlSL on weekly chart could take it to 4500.

Monday, November 21, 2011

Nifty P&F (Wk 1311 - 1711) - the bears approaching for a pause near 4700

Recap:

On weekly chart reading was correct, but on daily chart was damn wrong for a Bullish set-up.

Weekly Analysis:


Daily Analysis:


Summary:

All Bears. Support near 4700. VPO 4500.

Saturday, November 12, 2011

Nifty P&F (Wk 1311 - 1711) - support broken but BlSL held, a possible "Bear-trap"!

Recap:

Price broke-past 5150 marginally.

Weekly Analysis:


Daily Analysis:


Summary:

Weekly price on support zone. Daily breached support zone, but holding the channel bottom.

Expect Bulls to attempt channel top again! Bears 5140 >> 5100.

Sunday, November 6, 2011

Nifty Point & Figure (PnF) Analysis - Week 0611 - 1011

Recap:

Daily resistance came at 5400.

Weekly Analysis:


Daily Analysis:


Summary:

Weekly & Daily Consolidating. Full Bull above 5540! Bears 5150 >> 4940!

Value buying in equities can still fetch good returns.

Saturday, October 29, 2011

Most of the world markets have breached BrRL

Click here for this week's Nifty weekly analysis.

US Markets:


DOWJONES Broken BrRL. Approaching resistance near 12370!


S&P500 clear break-out. A channel top still to offer resistance.


NASDAQ broken BrRL. Gradually approaching the channel top.


Europe:


FTSE though broken BrRL might form an H&S pattern!

Asia:


NIKKEI too formed a bottoming pattern. However, the market is in long correction mode.

Friday, October 28, 2011

Nifty Point & Figure (PnF) Analysis - Week 3110 - 0411

Recap:

Bullish undertone got converted to Bulls.

Weekly Analysis:


Daily Analysis:


Summary:

All Bulls. Daily near resistance zone at 5430. Week near resistance zone 5460 >> 5540. A pullback from this should be good opportunity for some medium-term equity investment in some large cap stocks.

P&F once again proves that a simple price action is good enough to identify trend / range and reversal. Though it will take the weekly chart to signal a complete reversal, but the daily chart is showing good amount of reversal. A few points in support for the reversal:
  • A spread daily bottom and a plain double bottom at 4720.
  • This bottom coincides with 38.2% Fib-retracement
  • It has been a year (Oct'10 to Oct'11) for one cycle of correction.
  • Some large cap stocks are bottoming out.
If this is a reversal confirmed, we are heading for two targets: HPO of 5700 and VPO of 5940. Incidentally these are respective tops of previous up legs.

Monday, October 24, 2011

Nifty Point & Figure (PnF) Analysis - Week 2410 - 28011

Recap:

Remained rangebound.

Weekly Analysis:


Daily Analysis:


Summary:

All rangebound. Bullish undertone.

Tuesday, October 18, 2011

Nifty Point & Figure (PnF) Analysis - Week 1710 - 211011

Recap:

Bulls spent the week.

Weekly Analysis:


Daily Analysis:


Summary:

Weekly paused. Daily DOWN. Overall rangebound. Interesting week, with decision coming soon.

Saturday, October 8, 2011

Nifty Point & Figure (PnF) Analysis - Week 1010 - 141011

Recap:

Remained rangebound.

Weekly Analysis:


Daily Analysis:


Summary:

Weekly Halted. Daily Up. Still rangebound with Bullish undertone coming from a double-bottom.

Saturday, October 1, 2011

Nifty Point & Figure (PnF) Analysis - Week 0310 - 071011

Recap:

Was wrong in presuming Bulls were gone.

Weekly Analysis:


Daily Analysis:


Summary:

Weekly DOWN. Daily undecided. Overall rangebound. Range contracting fast. Chance of a false direction can not be ruled out.

Saturday, September 24, 2011

Nifty Point & Figure (PnF) Analysis - Week 2609 - 300911

Recap:

Bulls failed to take the chances.

Weekly Analysis:


Daily Analysis:


Summary:

Weekly, Daily both DOWN. Immediate support 4700 level. Old VPO of 4500 might play out soon.

Monday, September 19, 2011

Nifty Point & Figure (PnF) Analysis - Week 1909 - 230911

Sorry for defaulting on weekend post. Going through some rough patch of life. Hope to recover soon.

Recap:

Support came near 4920 level. Bulls have been given another chance too!

Weekly Analysis:


Daily Analysis:

Summary:

Weekly DOWN move halted. Daily nearing a support. Support near 4950 level. Resistance CMP. HPO target for Bulls 5350.

Friday, September 9, 2011

Nifty Point & Figure (PnF) Analysis - Week 1209 - 160911

Recap:

5150+ it did.

Weekly Analysis:


Daily Analysis:


Summary:

Weekly paused, Daily reversed. Support in the range 4940 - 4980.

Included SMA10, with a mark of "M" in the grid, though the value of the SMA10 is same as in any other chart, however, the significance of the same is different in PnF chart as both price and this point will move within the same column in a running trend showing the transition celarly. We will explore more on this later.

Friday, September 2, 2011

Nifty Point & Figure (PnF) Analysis - Week 0509 - 090911

Recap:

4720 reversed. 5100 reached.

Weekly Analysis:


Daily Analysis:


Summary:

Weekly UP. Daily UP but facing resistance. UP side target 5150+.

Saturday, August 27, 2011

Nifty Point & Figure (PnF) Analysis - Week 2908 - 020911

Recap:

4710 on it's way.

Weekly Analysis:


Daily Analysis:


Summary:

Bottom near 4700. Bears target 4500.

PnF Fundamentals:

As I am not able to dedicate much time to add to my "My P&F Knowledge Share Centre", I thought I will add little bit of my P&F with fellow readers. Though I know there are not many PnF enthusiasts around, I hope to create few through my share.

PO (Price Objective):

Though I have talked about it earlier, but today would like to share a few more on this. This is a gift to the PnF followers to set a target for a position often. As the word says Price Objective, it sets an objective with a direction of the price movement. It does not necessarily talk about the target but all it means that the objective of a major reversal / pause is to normalize the market valuation to the desired level. There are primarily two types of PO - Vertical Price Objective (VPO) & Horizontal Price Objective (HPO). These are named so not merely from geometric distribution of the price but also from the psychological momentum point of view.

In my earlier topics I have covered the basics of VPO & HPO. So I won't get into the construct of them. Straightway I would start sharing my view point on these two techniques in PnF.

VPO is counted when the price changes the direction following a sharp movement in one direction (in EW this is often the v-th / c wave). HPO is counted when the price halts at certain level and becomes range-bound (in EW this is often the corrective phase). Having said, my experience is HPO is more effective in lower time frame charts compared to VPO, which is more effective in higher time frame charts. So avoid HPO in weekly chart and VPO in hourly chart. VPO is more target oriented whereas HPO is direction oriented. There can be minute VPOs within a large VPO, however, HPOs within HPO is not in my experience. In recent times my observations over VPO has been quite satisfactory (fellow readers can appreciate the accuracy of this technique). Later I will turn up with few more charts and explain.

Saturday, August 20, 2011

Nifty Point & Figure (PnF) Analysis - Week 2208 - 260811

Recap:

Past 5050 now at 4800!

Weekly Analysis:


Daily Analysis:


Summary:

The long-term BlSL from 2200 level of Dec'08 has been broken marginally. Another 160-200 points fall and PnF officially will announce a BEAR year!

Short-term support near 4710 level. A med-term (VPO) target 4500!

Sunday, August 7, 2011

S&P500 Point & Figure (PnF) Analysis - Week 0808 - 120811

This Week's Nifty P&F Analysis is here.


Daily Analysis:

Summary:

S&P amdist lots of structural change technically has warned many things, however has not broken the last hope yet. Rather giving an opportunity to the global economy to avert the impending recession. A long-term support line from 860 level is still holding intact. I am looking at an optimistic scenario where it is possible for S&P to revert from this level and the world markets react to positivism!

Nifty Point & Figure (PnF) Analysis - Week 0808 - 120811

Recap:

3 weeks back we read Bears' target of 5050 here.

Weekly Analysis:


Also see the long-term BlSL (Bullish Support Line) is critically aligned with our VPO for a possible turnaround!


Daily Analysis:


Summary:

Weekly DOWN. Daily paused. Pullback expected near VPO 5020 - 5050 level.

Saturday, July 30, 2011

Nifty Point & Figure (PnF) Analysis - Week 0108 - 050811

Recap:

With loss of patience perhaps dropped the point of control from 5700 (2 weeks before) to 5660 (Last week reading). Should have been little more patient.

Weekly Analysis:


Daily Analysis:


Summary:

Weekly & Daily DOWN. Bears have to test 5470 level before next level starts.

Friday, July 22, 2011

Nifty Point & Figure (PnF) Analysis - Week 2507 - 290711

Recap:

Daily remained range bound.

Weekly Analysis:


Daily Analysis:


Summary:

Weekly & Daily hitting ultimate resistance line. 5660 decisive.