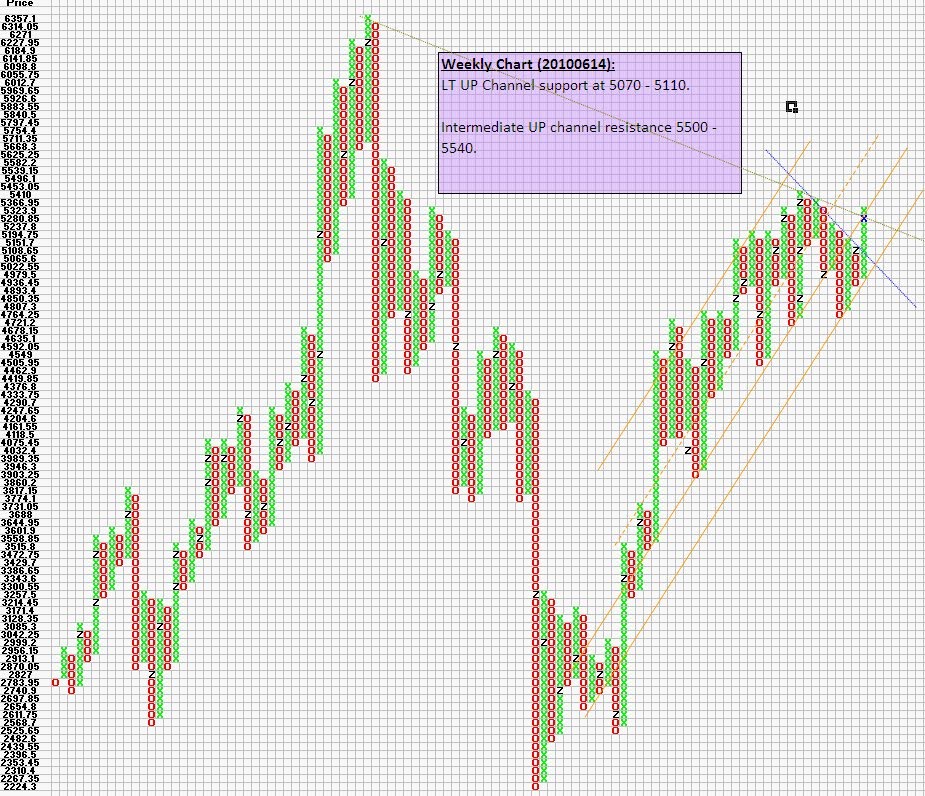
Weekly chart has met a resistance at 5300. Halfway pullback will support at 5190-5200. Major support at LT UP Channel at 5070 - 5110. Intermediate UP channel resistance will be met at 5500 - 5540.
Daily Analysis:

Daily chart shows Intermediate UP channel resisted at 5300. Pull back will get resisted halfway 5200 - 5240. LT UP Channel support at 5020 - 5070. Upward movement will be resisted at Intermediate Blue channel resistance at 5400 - 5450.
Hourly Analysis:

Hourly chart has come out of the Steep UP channel. First support at Intermediate UP channel at 5200 - 5210. Breaking which the next intermediate UP channel support comes at 5100 - 5110.
Summary:
Weekly break-out has happened. Minor retrace expected.
Daily chart also has broken-out of the lowest channel, minor retracement and the upmove should restart.
Hourly chart suggests immediate downward corrections.
No comments:
Post a Comment