Saturday, December 5, 2015

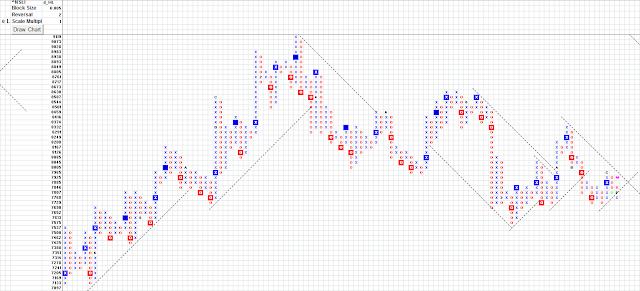
Nifty P&F (Wk 3108-0409) - consolidation would end beyond this range - (7550 - 8000)

Sorry for the delayed update ... however, the market has not gone anywhere.


Recap:

It was more of a correction - time bound. Still going on.


Weekly Analysis:


Daily Analysis:


Summary:


Weekly chart is getting pressure on the BrRL & therefore oscillating within the channel. The consolidation has more possibility to break upside
The Daily chart is showing strength to break up the BrRL.
Breaking above 8000, could take it to 8400 & that break would mean a new bull run. Breaking down 7690 could support 7550.

Saturday, August 29, 2015

Nifty P&F (Wk 3108-0409) - watch out the nature of fall; 8170 would arrest the fall else downward supports 7300 >> 7000 >> 6300

Recap:

Both 7916 & 7885 have been broken.

Weekly Analysis:

Daily Analysis:

Summary:

Weekness that was visible finally gave in. Sudden gap down fall has hit the VPO & in very short-term expecting a bit more consolidation before it resumes the fall. However, in the process of consolidation, if it crosses 8170, the fall could be arrested.

Weekly VPO is looking at a target of 6350. If the fall is a meltdown it might be soon. else, it might do the movement in the weekly channel. Supports in that case could be 7300 followed by 7000. My take is it's more of correction than a fall.

Sunday, May 3, 2015

Nifty P&F (Wk 0405-0805) - likely support at 7915, followed by 7885. If both fail, fresh assessment.

Recap:

"Nifty P&F (Wk 0501-0901) - If 8000 held, likely to test 9000 before bending!"

On 31st Dec, my last post this was the reading. Market moved till 9100 & now bent and nearing 8000.

Weekly Analysis:


Daily Analysis:


Summary:

Since 9000, almost 1000 points corrections have happened already. There is sufficient weakness in the chart. Weekly chart closing below 7915 could be the first sign. Daily chart showing a VPO of 7885. If a reversal does not happen from here. We'll have to look for a fresh downard target from weekly chart.

Wednesday, January 7, 2015

Excel free tool for Point & Figure (P&F) charting

Reposting as the link has been updated through dropbox link.

This is a little contribution from my side. Over the years, I have developed this point and figure software. Standard softwares in the market are costing around $25 - $150, but this excel-based software is free of cost.

Features of this software:
  • Simple excel-based software; does not require any installation
  • Can draw on both High-Low price method & Close price method
  • Can follow a wyckoff method of plotting for 1-point reversal
  • Scales can be altered, rounded off as per trader's preference
  • Automatic data retrieval from http://finance.yahoo.com/
  • Manual data can also be used
  • Any box-reversal is possible
  • Charts can be used for any time-frame data
  • Change in month is identified in the chart itself
  • Suggests suitable block-size for the available data-set
  • And many more for you to explore ...
Acknowledgement:
  • Some person in some forum had shared a base-level code. But it was quite faulty both fundamentally & technically. I don't remember that person's name. But I sincerely thank that person for having made this work possible.
  • Also I thank my e-Guru, iLango, for inspiring me to do the act of sharing to the trading community.
The link to download the file can be accessed from this link here.