This blog attempts to analyze movement of Nifty through the age-old Point & Figure method. Weekly chart would imply the movement of Nifty for the weeks to come and not necessarily the immediate next week. Same is true for other time frame charts. As price action unfolds every week the charts speak for due course of action. DISCLAIMER: NOTHING IN THIS BLOG SHOULD BE TAKEN AS TRADE ADVICE
Friday, May 27, 2011
Saturday, May 21, 2011
Monday, May 16, 2011
Nifty Point & Figure (PnF) Analysis - Week 1605 - 200511
Well, I'm back. But with lot of changes. A new system has put a lot of restriction to my overall freedom. I won't be able to follow-up on hourly charts. I think this might be a 'blessing in disguise'. Slowly, I'm becoming a strong believer of the fact that hourly (minutely or secondly) monitoring the market is not professional trading but mere addiction. It does not mean we don't read the hourly tape. We do need to study them to understand the behaviour of the price point at decisive points (would like to spend some time on it later when time permits).
Simple trading method:
Daily Analysis:
Summary:
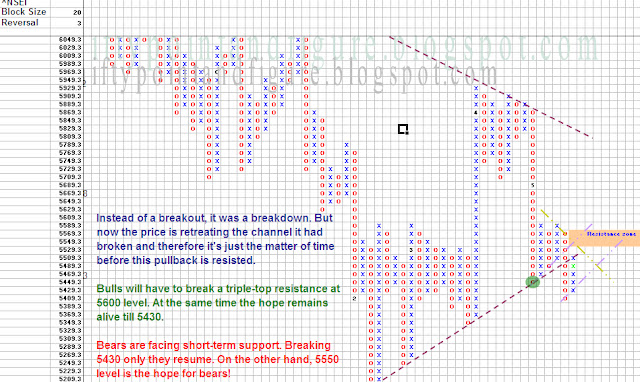
Weekly on verge of breakdown below 5420. Daily DOWN after moving past 5490. Daily chart HPO has a target of 5270.
Simple trading method:
- Enter at predecided levels
- Keep part-booking slowly and exit at pre-decided level
- WAIT and enjoy the non-decisive moves
- Go to step 1
Daily Analysis:
Summary:
Weekly on verge of breakdown below 5420. Daily DOWN after moving past 5490. Daily chart HPO has a target of 5270.
Subscribe to:
Posts (Atom)


