Monday, January 31, 2011

East far from West?

2008 west preceded the fall. Rather it was the cause of the very fall. East followed. This time how is the story? Trying to evaluate the scene for S&P500 as it looks today.

Weekly Chart:


Daily Chart:


Summary:

Weekly chart is quite firm. It does not show any major weakness in weekly chart. Daily chart in short-term shows some stiff resistance either at 1312 or 1372 level. If the fall in East is fundamental enough West can not stay far off for long! Similarly, if West is going strong towards North, it will be interesting to see how long can East go towards South?

All Sold? Hold Gold!

They say Gold is the safest heaven for any investment. Which is all the more true when all other investments are falling apart. If we recollect, the story of 2008 market fall, Goldbees stayed in a range (1120 - 1320) bound market. That means, it we can get the lower-bound of this range, we can hold Gold as long as the market corrects.

Let's see how the Goldbees (Gold ETF traded in NSE market) chart looks in daily & weekly window.

Daily Chart:


Weekly Chart:

Summary:

Both the charts indicate a correction to Gold market happening. Correction should halt at 1850 level. If it breaks past this 1680 could be the level to buy and hold. A nice strategy could be to buy Gold at this point as SIP (Systematic Investment Plan) - i.e. buy at current price (1920) level (because in daily chart it has a support) here, then again at 1850 level, and may be in truck load if  achieves1680 level.

Saturday, January 29, 2011

Nifty Point & Figure (PnF) Analysis - Week 100131 - 0204

Weekly Analysis:


Daily Analysis:


Hourly Analysis:

Summary:

Immediate DOWN support 5380 - 5420. UP side resistance 5550 level.

Chances of Bulls look completely gone. Two weeks before I was of the same opinion but last week's reasonable Q3 results hinted perhaps it will take few more months before it gives in. I don't see bulls can be back from here. Only thing we need to gauge now the power of this destruction whether it will be slow & steady or fast & furious (one like that in 2008). There will again be panic in the market. It will take 2-3 more months for the street to realize that. And last but not the least 6 months for the economic recession to set in!

Friday, January 21, 2011

Nifty Point & Figure (PnF) Analysis - Week 100124 - 0128

Weekly Analysis:


Daily Analysis:


Hourly Analysis:


Summary:

A pause for a direction. DOWN side support 5500 - 5540. UP side resistance 5860 - 5880.

Saturday, January 15, 2011

Nifty Point & Figure (PnF) Analysis - Week 100117 - 0121

Weekly Analysis:


Daily Analysis:


Hourly Analysis:


Summary:

All DOWN. Immediate support 5550. Watch 5420 - 5460 for another session of economic recession.

Saturday, January 8, 2011

Nifty Point & Figure (PnF) Analysis - Week 100110 - 0113

Weekly Analysis:


Daily Analysis:


Hourly Analysis:


Summary:

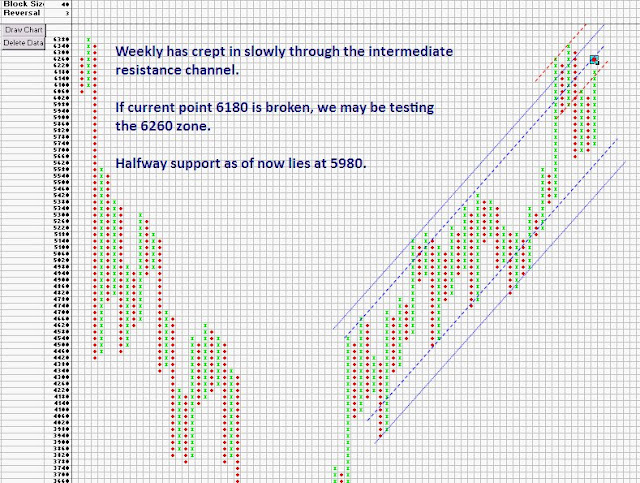
6180 turned out to be a good reading. Strongly started believing prices always move within channels. Only things many a times those channels are not straightway obvious.
Weekly & Daily DOWN. Weekly & Daily support around 5800 level. Daily is not readable. Watch out for a short at 5930 level which might come on Monday!
Note: In the hourly chart read the line "The PnF veterans ... 40 point ... bounce back" as "The PnF veterans ... 20 point ... bounce back". Sorry for the mistake.

Saturday, January 1, 2011

Nifty Point & Figure (PnF) Analysis - Week 100103 - 0107

Weekly Analysis:


Daily Analysis:


Hourly Analysis:


Summary:

Weekly UP. Daily with minor resistance. Hourly undecided. Resistance 6150 - 6180 - 6300. Support 6010 - 6070.