Showing posts with label PnF Analysis. Show all posts

Wednesday, July 6, 2016

Nifty P&F (Wk 1207-1907) - Reached mid-term resistance line, profit booking to be expected

Recap:

Test of faith would have wonderfully worked, nifty bounced back from the channel bottom. While we expected 6750, it happened at 6800 itself. Nice 1400 pts movement from there.

Weekly Analysis:


Daily Analysis:


Summary:

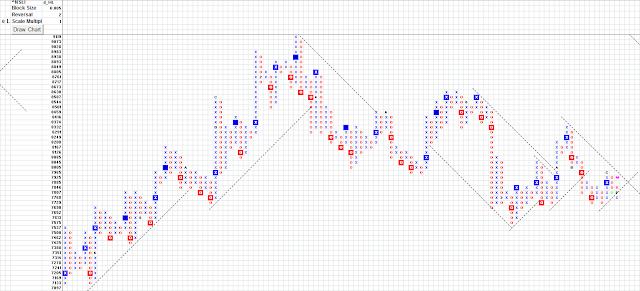
Weekly chart has BrRL & expected profit booking in mid term.
Daily chart also coincides reaching the VPO.
Hence, profit booking is solicited in mid-term. Long-term outlook stays bullish though.

Saturday, February 13, 2016

Nifty P&F (Wk 1502-1902) - daily chart targets 6750, weekly chart support 6600

Recap:


It has reached the channel bottom.


Weekly Analysis:


Daily Analysis:


Summary:


Daily chart has a VPO target of 6715-6750.
Weekly chart shows long-term BlSL at 6600. VPO in the chart is 6450. I would guess this would be the ultimate support. Breaking these levels are really bad for real long-time.
This also gives us wonderful opportunity with a test-of-faith that these levels hold for long-term investment.

Saturday, February 6, 2016

Nifty P&F (Wk 0802-1202) - the oscillating channel controlling the price movement, nice trade opportunity

Recap:


Though the range has broken 7500, still price is oscillating inside the channel with all the possibilities to break upside.


Weekly Analysis:


Daily Analysis:


Summary:


Daily chart indicating breaking 7615 would mean a break out of BrRL. On weekly chart 7000, is the support on BlSL.

Saturday, December 5, 2015

Nifty P&F (Wk 3108-0409) - consolidation would end beyond this range - (7550 - 8000)

Sorry for the delayed update ... however, the market has not gone anywhere.


Recap:

It was more of a correction - time bound. Still going on.


Weekly Analysis:


Daily Analysis:


Summary:


Weekly chart is getting pressure on the BrRL & therefore oscillating within the channel. The consolidation has more possibility to break upside
The Daily chart is showing strength to break up the BrRL.
Breaking above 8000, could take it to 8400 & that break would mean a new bull run. Breaking down 7690 could support 7550.

Saturday, August 29, 2015

Nifty P&F (Wk 3108-0409) - watch out the nature of fall; 8170 would arrest the fall else downward supports 7300 >> 7000 >> 6300

Recap:

Both 7916 & 7885 have been broken.

Weekly Analysis:

Daily Analysis:

Summary:

Weekness that was visible finally gave in. Sudden gap down fall has hit the VPO & in very short-term expecting a bit more consolidation before it resumes the fall. However, in the process of consolidation, if it crosses 8170, the fall could be arrested.

Weekly VPO is looking at a target of 6350. If the fall is a meltdown it might be soon. else, it might do the movement in the weekly channel. Supports in that case could be 7300 followed by 7000. My take is it's more of correction than a fall.

Sunday, May 3, 2015

Nifty P&F (Wk 0405-0805) - likely support at 7915, followed by 7885. If both fail, fresh assessment.

Recap:

"Nifty P&F (Wk 0501-0901) - If 8000 held, likely to test 9000 before bending!"

On 31st Dec, my last post this was the reading. Market moved till 9100 & now bent and nearing 8000.

Weekly Analysis:


Daily Analysis:


Summary:

Since 9000, almost 1000 points corrections have happened already. There is sufficient weakness in the chart. Weekly chart closing below 7915 could be the first sign. Daily chart showing a VPO of 7885. If a reversal does not happen from here. We'll have to look for a fresh downard target from weekly chart.

Tuesday, December 30, 2014

Nifty P&F (Wk 0501-0901) - If 8000 held, likely to test 9000 before bending!

Recap:

Price did not go till 7500, it reversed from 7700 only.

Weekly Analysis:

Daily Analysis:

Summary:

I was expecting a reasonable correction on reaching VPO, however recent consolidation HPO indicates a potential of reaching 9000 before buckling down. Provided it does not  break the BlSL at 8000.

Saturday, October 11, 2014

Nifty P&F (Wk 1309-1709) - Correction in all likelihood is on till 7510!

Review:

A reversal has triggered 400+ points, is it over let's see!

Weekly Analysis:


Daily Analysis:


Summary:

BlSL giving support at current price if breaks a chance to visit 7510. Looking at the weekly chart, in all likelihood the correction is not over. Some red 'O's are to be printed before it starts the upmove again.

Sunday, September 7, 2014

Nifty P&F (Wk 0809-1209) - 8250 is there, a pause or reversal, weekly VPO target 11200!

Review:

In May it was set for 8250, it has reached there. Very effective long-term investment technique.

Weekly Analysis:

Daily Analysis:

Summary:

VPO reaching near 8250, likely to pause near short-term. Till the VPO of weekly chart set for another 17 pts (on Logarithmic scale of 0.02) it would mean 11200! God knows when!

Sunday, May 25, 2014

Nifty P&F (Wk 2605-3005) - VPO on weekly chart set at 8250, short-term resistance at 7450!

Weekly Analysis:

Daily Analysis:


Summary:

VPO on weekly chart 8250. Daily chart getting resistance at BrRL @ 7450, breaking it up will resume the movement.

Saturday, March 29, 2014

Nifty P&F (Wk 3103-0403) - Price has reached VPO of weekly chart, fresh longs to be avoided

Weekly Analysis:

Daily Analysis:


Summary:

Weekly pattern : DT BO
Daily pattern : Multiple DT BO.
HPO (D) : -
VPO (D) : -
BlSL (D) : 6500
BrRL (D) : -
BlSL (W) : 5935
Sorry have been away from market actively for quite some time due to some emergency. Have a long backlog. Looking for hourly data of Nifty spot for the month of March, if anybody has it please share it.

Saturday, February 22, 2014

Nifty P&F (Wk 2402-2802) - Selling pressure till 6225, however bullishness expected above 6300

Recap:

Got sold at 6135 once, got bought also at 5980. However, it broke out of the triangle on long-side.

Weekly Analysis:

Daily Analysis:

Summary:
Weekly pattern : Likely high-pole reversal.
Daily pattern : DT BO.
HPO (D) : -
VPO (D) : 6225
BlSL (D) : 6010
BrRL (D) : 6225
BrRL (W) : 6290

Overall the selling pressure is visible in both Daily & Weekly charts. A confluence around 6225 indicates some action around it. Wait for the direction there.

Sunday, February 9, 2014

Nifty P&F (Wk 1002-1402) - trading opportunity between 6135 - 5980

Recap:

Break of 6255 followed another 275 points fall.

Weekly Analysis:

Daily Analysis:

Summary:

Weekly pattern : Likely high-pole reversal.
Daily pattern : High pole reversal.
HPO (D) : -
VPO (D) : -
BlSL (D) : 5950
BrRL (D) : 6135
BrRL (W) : 6290

Two opposing high-pole reversal in two time-frames indicate a range-bound movement for some time till the contracting triangle (under formation) in daily chart gets resolved.

Sunday, January 26, 2014

Nifty P&F (Wk 2701-3101) - Failure of 6255 may activate the bearish nature in short term.

Recap:

6355 acted twice as resistance.

Weekly Analysis:


Daily Analysis:


Summary:

Weekly pattern : Spread Top BO.
Daily pattern : DT (Double Top) BOF (Break Out Failure).
HPO (D) : -
VPO (D) : 6450
BlSL (D) : 6256, 6041
BrRL (D) : 6351

If it breaks the the BlSL(D), it's going to get bearish. However, if gets supported, may continue the upmove.

Sunday, January 5, 2014

Nifty P&F (Wk 0601-1001) - Immediate term bearish till 6355. Fall may continue till 6100 or 5920.

Recap:

A one-box fake-out by 3 points. Expected 6355 but went till 6358.

Weekly Analysis:

Daily Analysis:


Summary:

Weekly pattern : Spread Top BO.
Daily pattern : High Pole Reversal.
HPO (D) : -
VPO (D) : 5862
BlSL (D) : 6100, 5920
BrRL (D) : 6288-6320

Sunday, December 29, 2013

Nifty P&F (Wk 3012-0301) - Reasonably bullish, above 6355, strength returns.

Happy New Year 2014. Wish you a very Prosperous & Profitable year ahead!
==================================================================================

Recap:

Daily weakness kept the price soft, but still not cleared 6355!

Weekly Analysis:

Daily Analysis:


Summary:

Weekly pattern : Spread Top BO.
Daily pattern : Rising Bottm, Double top BO buy. BrRL hit.
HPO (D) : -
VPO (D) : 6350
BlSL (D) : 6225-6256
BrRL (D) : 6320-6350

Sunday, December 22, 2013

Nifty P&F (Wk 2312-2712) - Weekly strong, daily weak. Above 6355, strength returns.

Recap:

Look at the chart BlSL 6100-6130 level played as support.

Weekly Analsysis:

Daily Analysis:

Summary:

Weekly pattern : High pole.
Daily pattern : Rising Bottm (yet to confirm)
HPO (D) : -
VPO (D) : -

BlSL (D) : 6160-6190
BlSL (W) : -

Sunday, December 15, 2013

Nifty P&F (Wk 1612-2112) - Short-term weakness in support zone till 6100

Recap:

As said the bull strength still remains. VPO (D) 6370 was achieved.

Weekly Anlaysis:

Daily Analysis:
 

Summary:

Weekly pattern : Semi-Catapault.
Daily pattern : High pole.
HPO (D) : Achieved
VPO (D) : Achieved

BlSL (D) : 6100-6130
BlSL (W) : 5745

Sunday, December 8, 2013

Nifty P&F (Wk 0912-1312) - Till 6155 current Bull trend in-tact

Recap:

Break-out got stronger by leaps.

Weekly Analysis:

Daily Analysis:
 

Summary:

Weekly pattern : Semi-Catapault.
Daily pattern : Double Top break-out.
HPO (D) : 6310-6340
VPO (D) : 6370

BlSL (D) : 6155
BlSL (W) : 5745

Saturday, November 30, 2013

Nifty P&F (Wk 0212-0612) - Break-out in all charts buy till 6060!

Summary:

I still say the long-term looks quite good.

Weekly Analysis:

Daily Analysis:


Summary:

Weekly pattern - Semi-Catapault.
Daily pattern - Double Top & BrRL break-out.

High probability that longs will be sustained. Buy at every opportunity of pullback till 6090 & exit longs at 6060 level. As of now multiple channel (BlSL) support lies till 5880 level.

Note:

As you see from the charts, there have been few key changes:
  • Scale changed to logarithmic
    • Weekly - 2% (Box Size) & 3 (reversal)
    • Daily - 0.5% (Box Size) & 2 (reversal)
  • Simple signal (Double Bottom / Top break-out) wherever applicable
Also I'll try to make my analysis more relevant to the books of Point & Figure. Let me know, how you like the changes.